US Pharma · Patient analytics · Global pharmaceutical company
From clickstream to launch decisions: analytics for digital patient companions
Every drug shipped with a digital companion, whether an app, a site, or a device. I led the team that turned clickstream, market, and finance data into actionable launch analytics, enabling the business to make faster decisions across multiple launches simultaneously.
- 8–10Analysts mentored across parallel project launches
- 5 sourcesStitched together to answer business queries
- A→Vone funnel: acquisition to value
scroll the story

01 — The question
A drug launches. The companion needs to prove it's working, immediately.
These apps help patients live with a disease — journaling, pain and sleep tracking, photo logs, medicine reminders, education — and the launch team's first question is whether the right patients are finding it and sticking with it.

02 — The craft
One funnel from first tap to clinical value
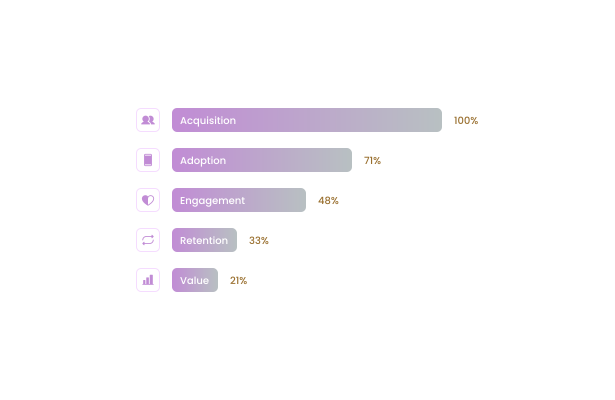
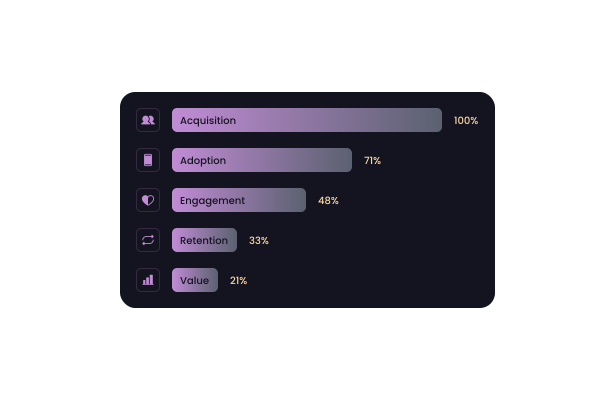
I framed every companion as a single journey — Acquisition, Adoption, Engagement, Retention, Value — so a launch team could read the whole story in one line of sight, and see exactly where a patient dropped off and which feature brought them back.
- 5 stagesone shared definition of success
- Feature-levelwhich features earned their place

03 — The data
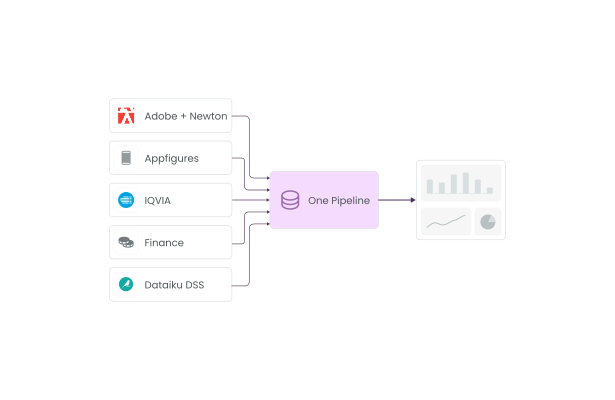
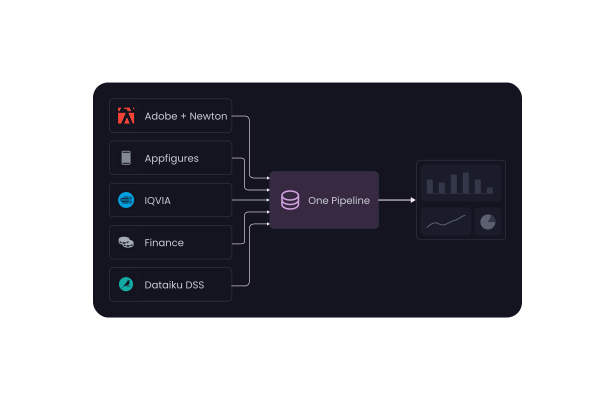
Five unrelated data worlds, stitched into one view
Clickstream, in-app, app-store, market, and finance data each told only part of the story. We brought them together into one trusted pipeline for every launch, combining Adobe and Newton sessions, Appfigures ratings, IQVIA market data, and internal finance data.
- 5 sourcesone pipeline per launch
- Full sessionsclickstream stitched end-to-end
04 — My role
On-time and On-budget delivery across all parallel launches
Discovery, project plan, architecture, pipelines in Dataiku, dashboards in Tableau, QA, UAT, hypercare, handover — run Agile, across many launches at once, while managing the team, the budget and the burn-rate.
- End-to-enddiscovery → handover + docs
- On budgetto immovable launch dates
05 — The handoff
Then I handed the teams the keys
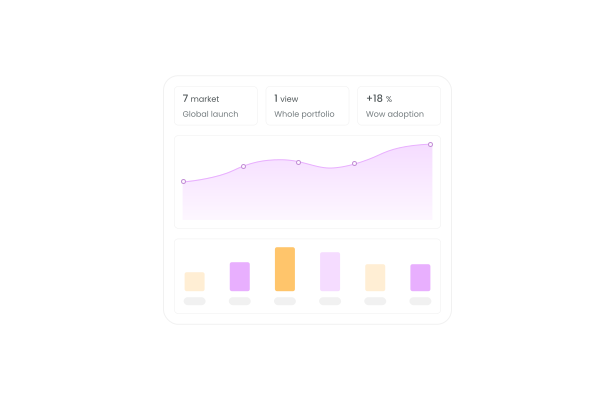
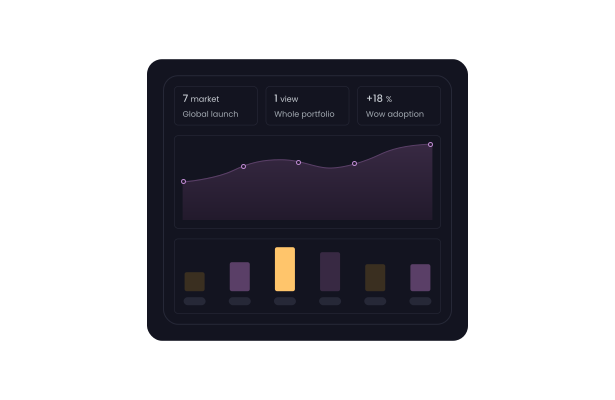
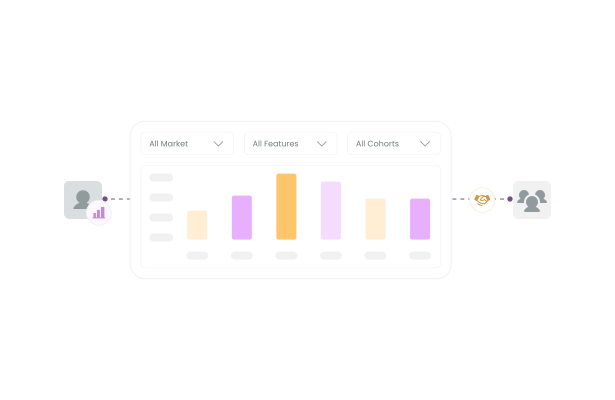
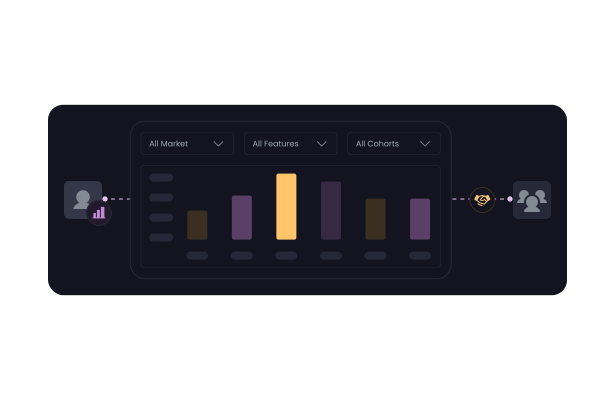
Beyond the dashboards, I provided each launch team with a self-serve exploration tool to independently answer ad-hoc questions about markets, features, and cohorts without having to wait for our team.
- Self-servead-hoc analysis, no dev queue
06 — What I'd carry forward
Leading a team of Associates was a real learning opportunity, understanding their strengths and goals made things easier.
- Managing Client expectations and understanding the key requirements before project start
- Identified the Launch Analytics frequent queries and standardized the reports to cover them
- Kept team focused on what actually mattered most and derived upskill opportunities for associates